Purpose
Whenever I deploy a new resource to a server, one question always comes to mind: How many users could be served? The range of possible events is vast, so my goal in this article is to simplify these complexities as much as possible and bring clarity to this question.
HW
So let's talk about hardware. We will be using a machine with the following specs:
- CPU: 4 Cores, 2.8-3.2 GHz
- RAM: 6 GB
SW
Even when there is no traffic or external load, the deployed services still consume a significant amount of resources. In my case, this can be simplified to an average idle state of:
- ALL OF THEM ~ 50% RAM, 3.5% CPU
Most consuming services:
- DB services ~ 15%
- Java services ~ 14%
- Data monitoring services ~ 2.9%
- Data extraction services ~ 1.5%
Load testing
Let's gather some data. The testing will be divided into three phases, targeting a 1.1MB web service, using the Loader.io toolset:
- Ramp up
- Consistant load per second
- Peak load
While performing those tests, I will add an additional manual request to provide with insight about how responsive it is. Not just responding but providing the whole package.
--- Ramp up test ---
Here, requests will be added on a linear way overtime to see the service limits.
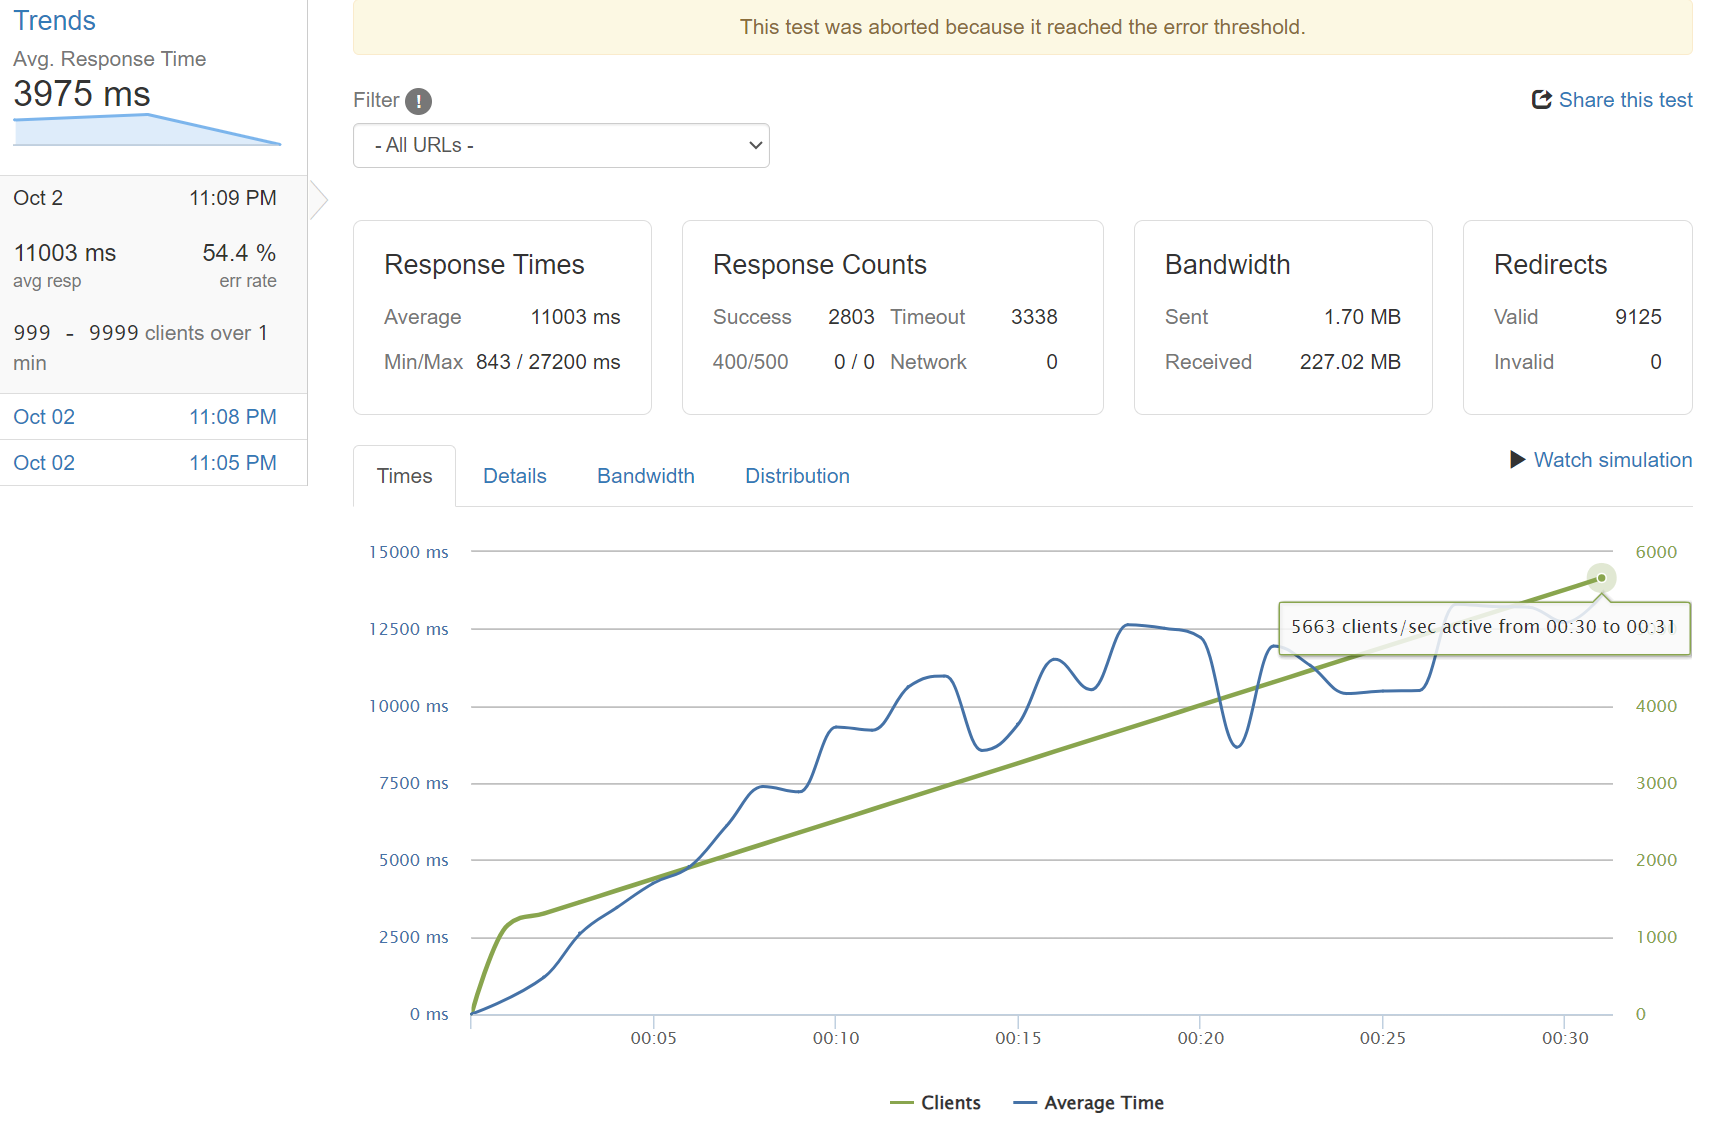
Ramp up
Parallel request took up to 5sec of loading time.
As we can see in the graph, accumulating up to 5663 concurrent requests will result in a resource shortage and an inaccesible service.
--- Consistant load per second test ---
Here, a continuous amount of requests will be sent consistantly every second.
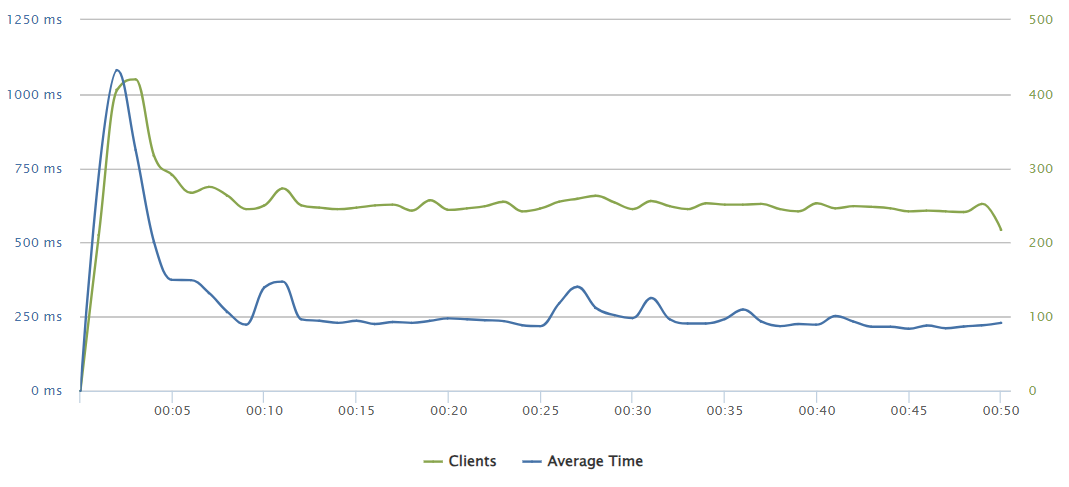
200 requests/sec
Parallel request was served instantly.
In the graphs we can appreciate how the amount of concurrent served requests is stable and the response times are quite low.
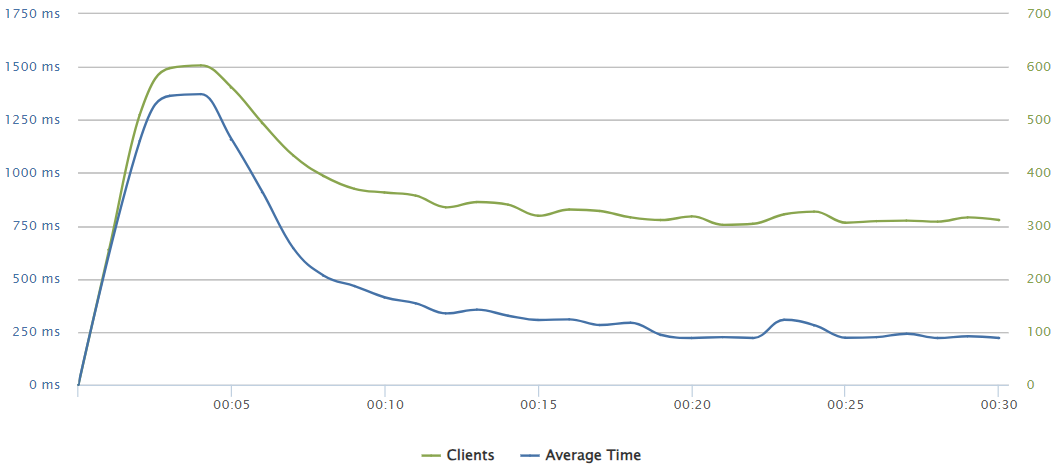
250 requests/sec
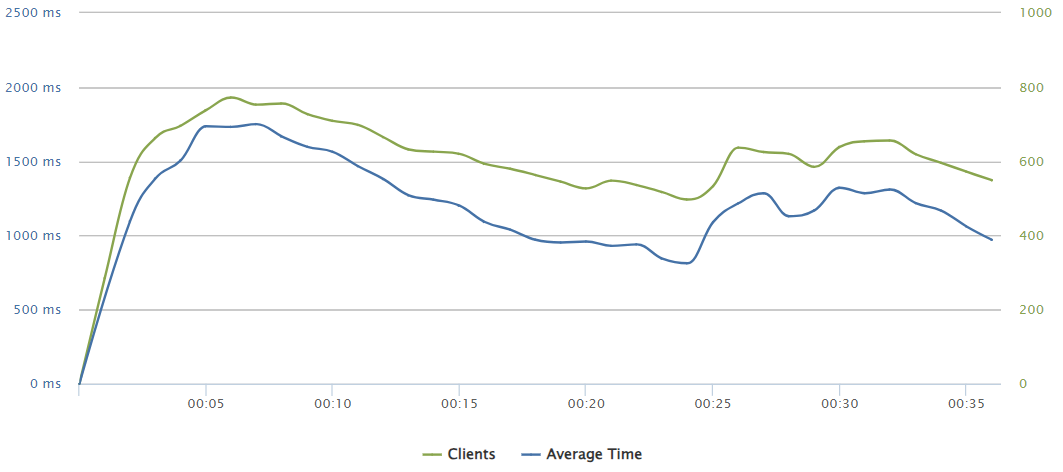
275 requests/sec
Up to 275 req/s, the ux is consistantly fine and a load discharge can be appreciated in the graphs.
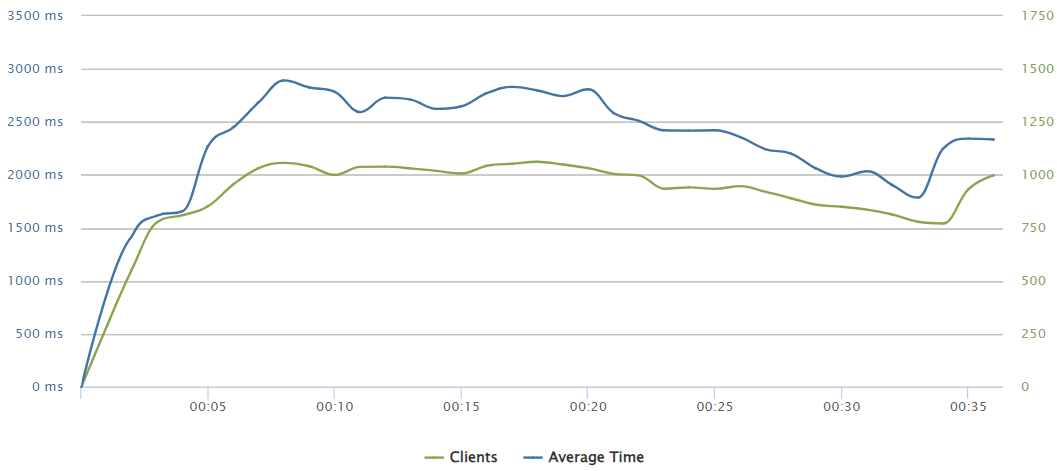
280 requests/sec
Slightly above on 280 req/s we can appreciate how the load discharge rate is not so effective and it even impacted on the parallel request increasing the loading time up to 4 seconds.
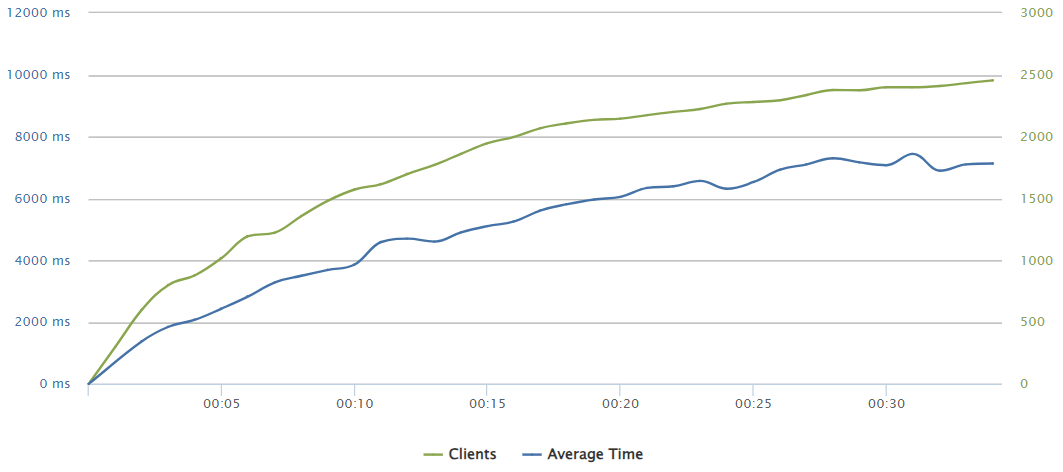
290 requests/sec
Here we can see how the request rate produces a divergence in the amount of concurrent users, what causes load times up to 11 seconds. But it did not produce any loss. Based on the following information, it can be estimated that it could have been serving for several minutes before starting to present any issues.
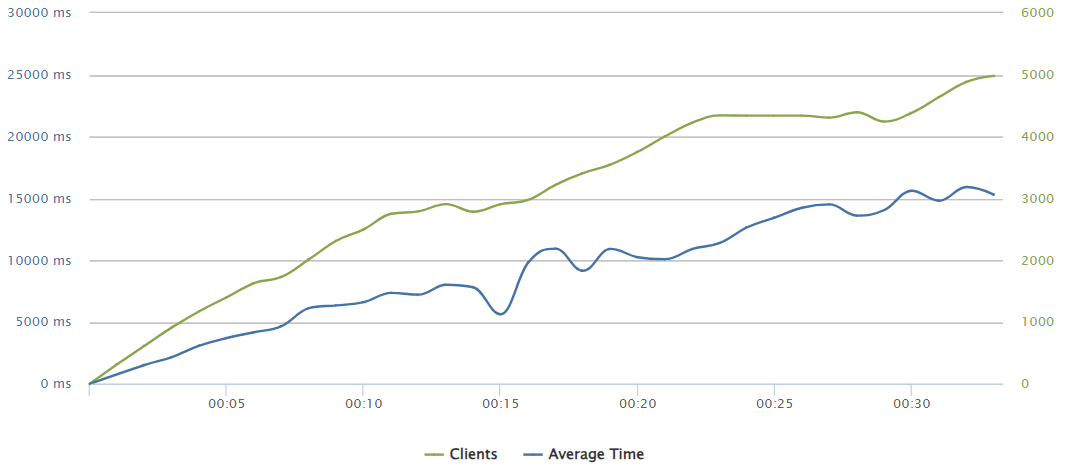
300 requests/sec
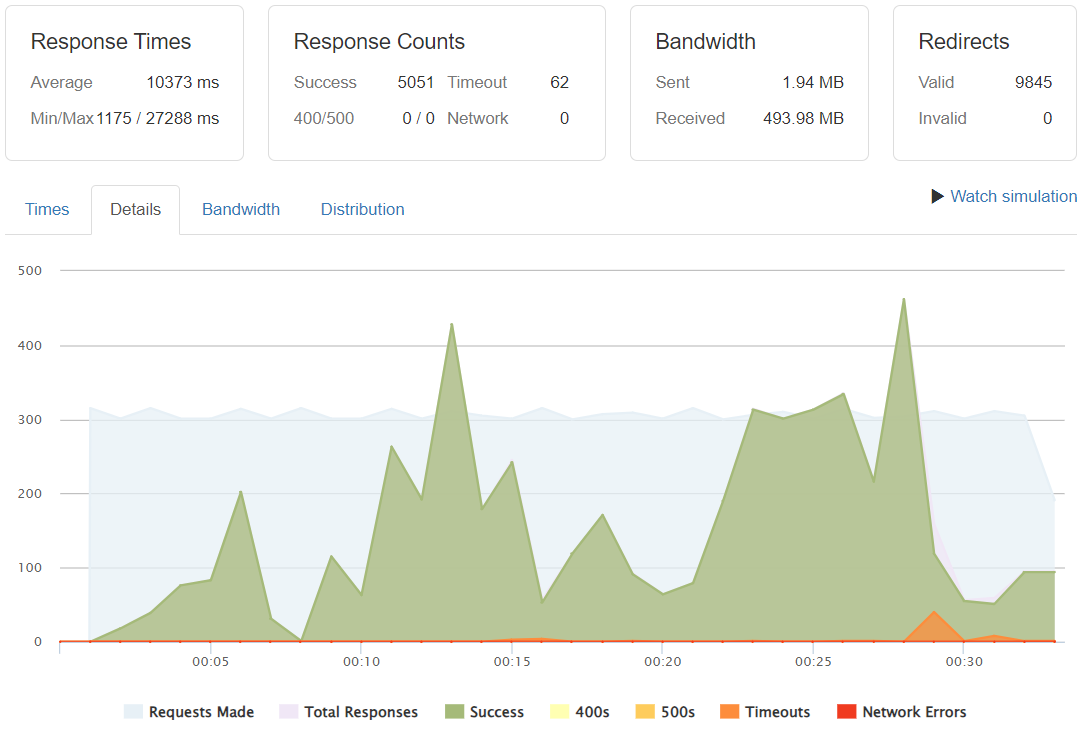
Requests/Success/Timeouts
At a rate of 300req/sec we can start to see how the first instability issues arise. They turn noticeable when reaching up to 4500-5000 concurrent users being served.
But how much would affect to keep adding higher rates? Let's find out.
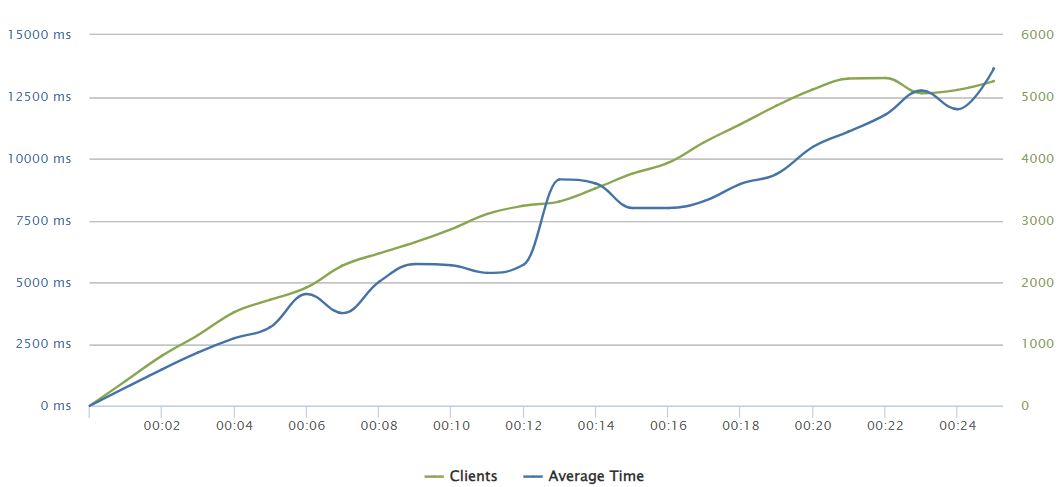
400 requests/sec
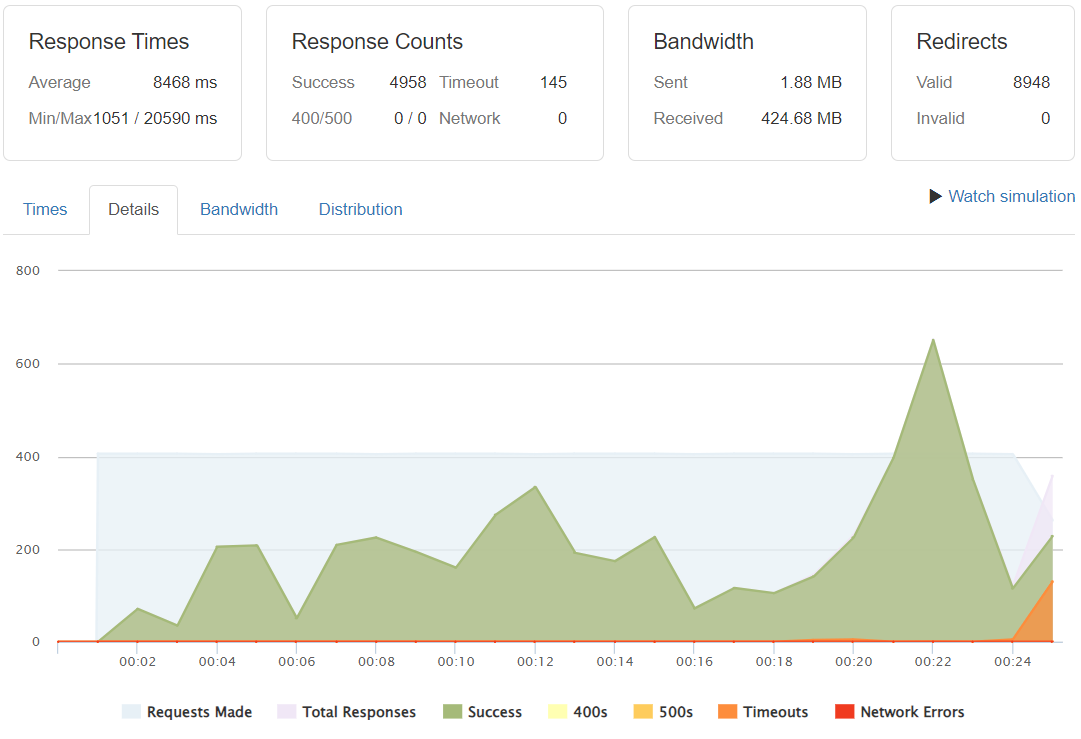
Requests/Success/Timeouts
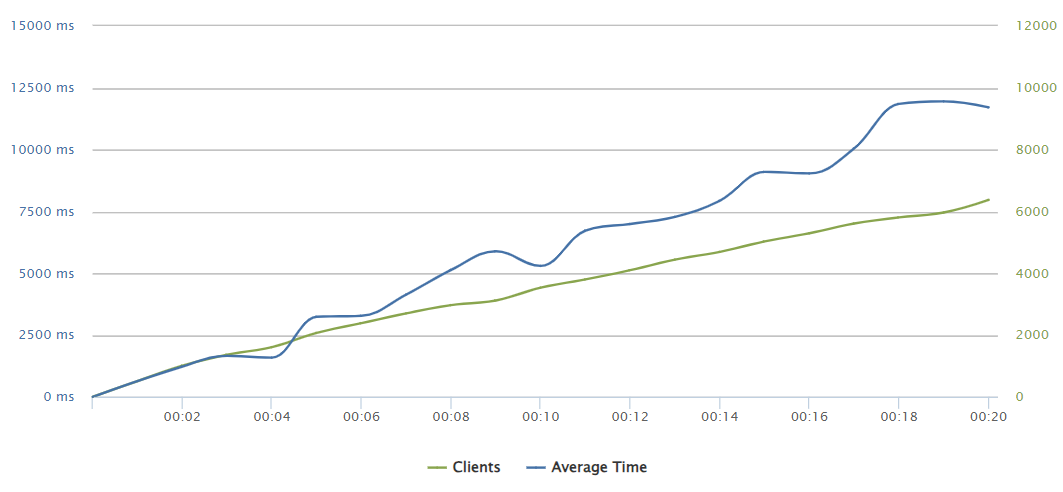
500 requests/sec
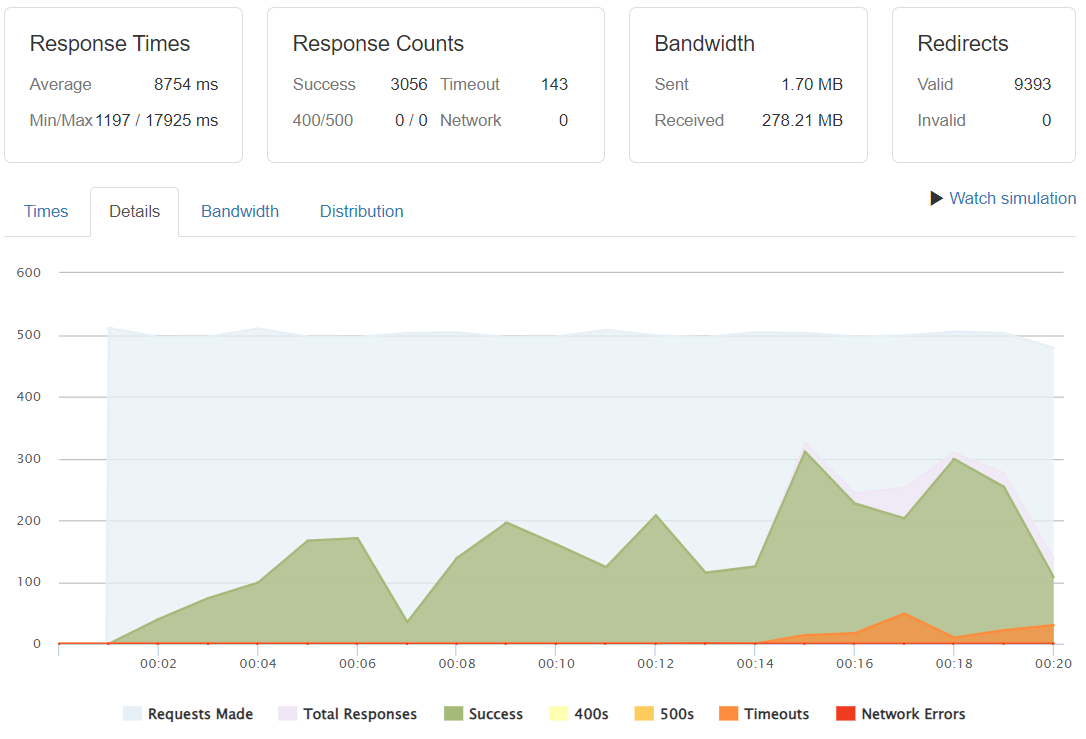
Requests/Success/Timeouts
Surprisingly the timeout rates did not convert themselves as a majority. Indeed the scenario does not become crytical in terms of not actually serving, but we are out of any reasonable UX experience with complete load times of 12 and 14 seconds respectively for the 400 and 500 req/sec rates.
--- Peak load test ---
To finish with the analysis let's analyze how many pushed requests can be served at once.
With a little more complex scenario, we will mantain a constant amount of users, so it will have the initial peak but also, it will compensate afterwards to mantain a certain amount of concurrent users.
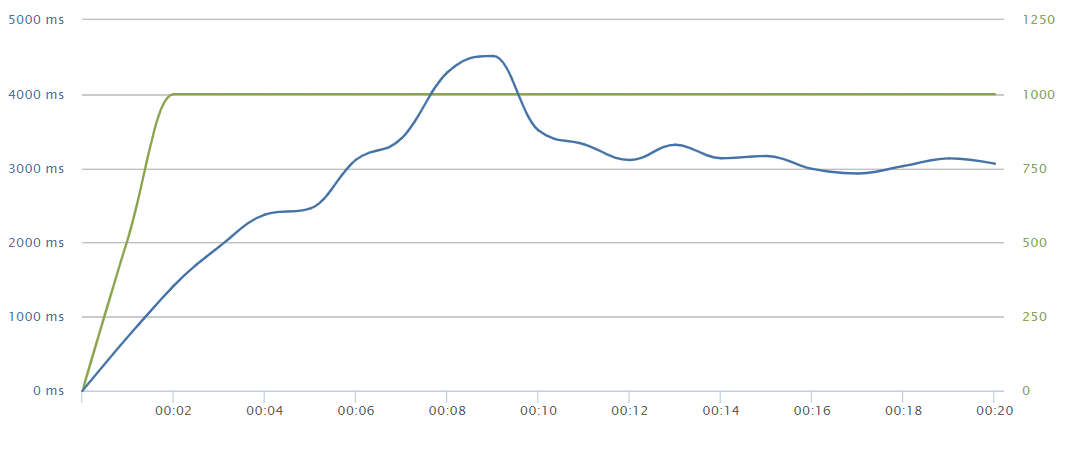
500 requests/sec
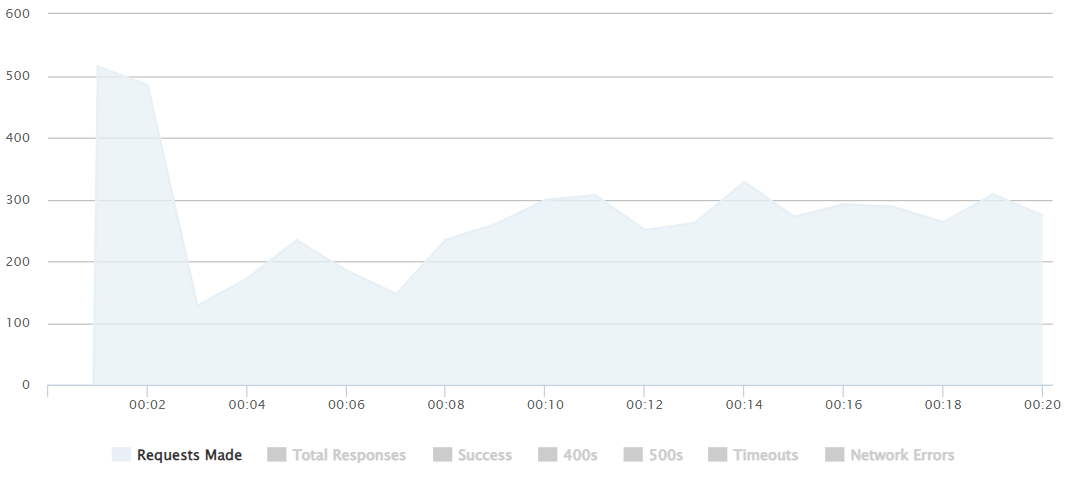
Requests/Success/Timeouts
With a peak of a 500 request push, we can notice how quickly (after 2-3 seconds) it starts adding more requests as all the peak requests were being resolved efficiently.
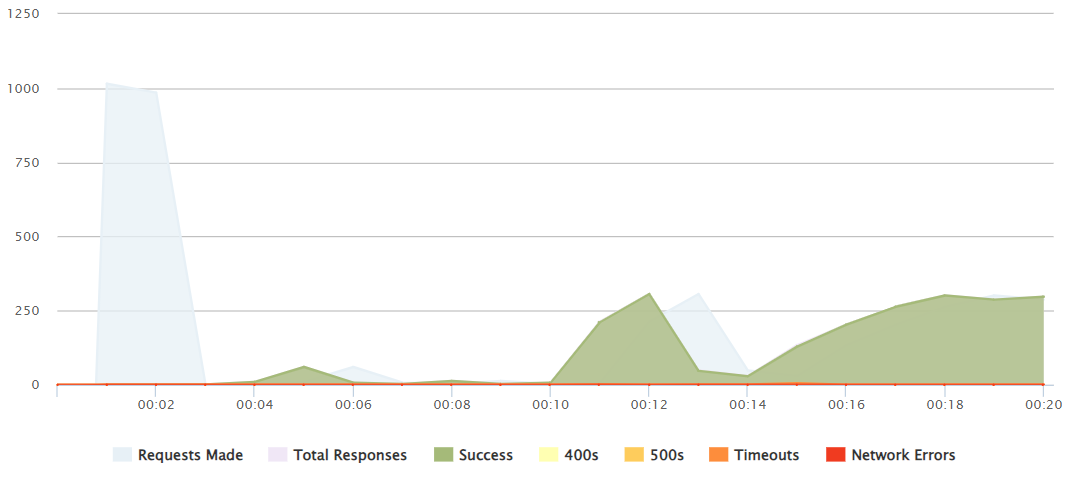
1000 peak
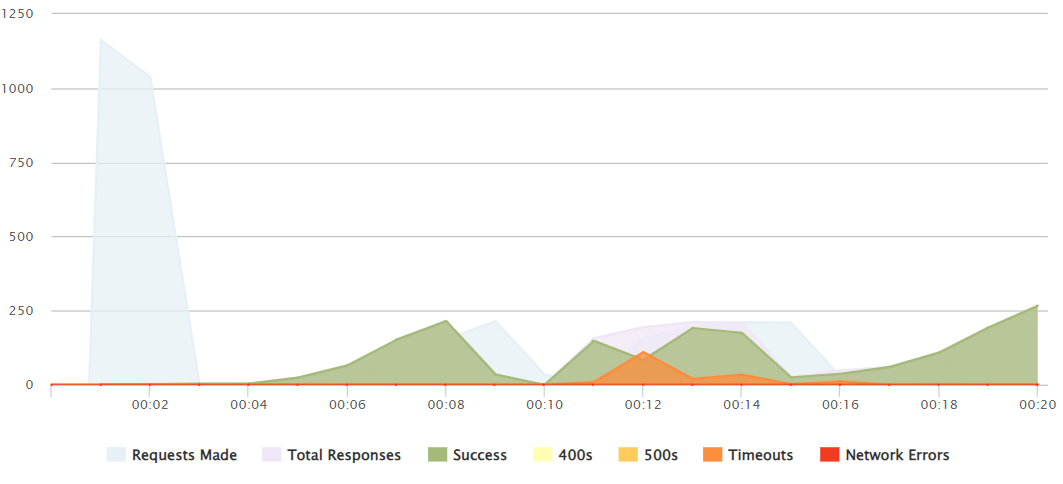
1100 peak
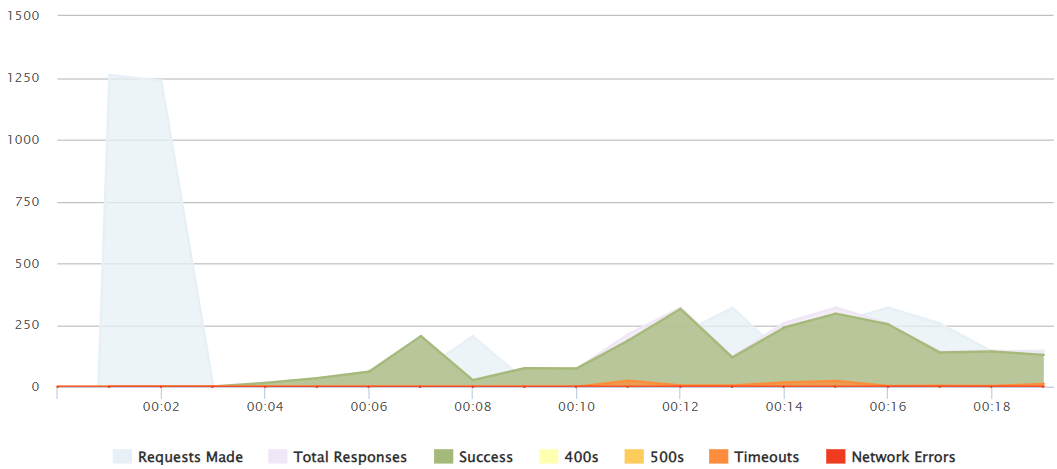
1250 peak
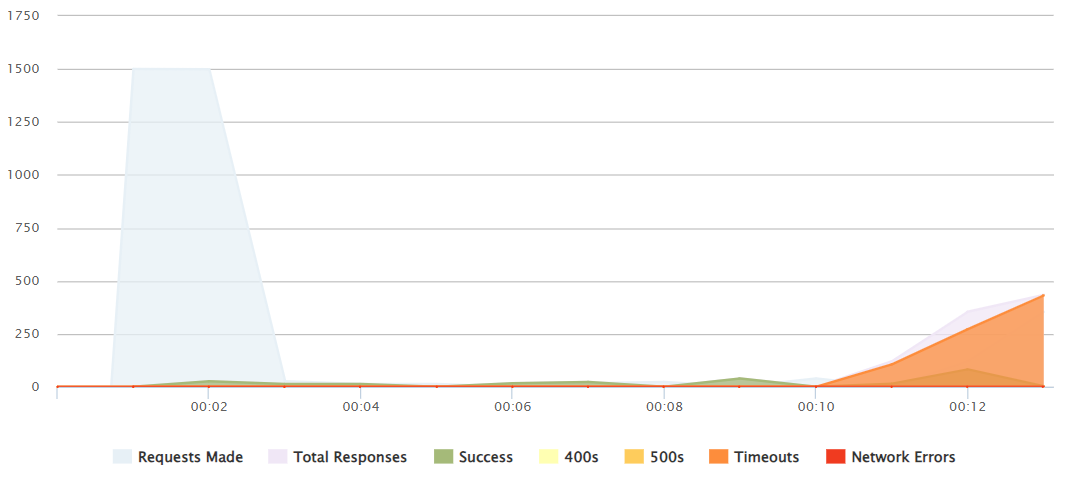
1500 peak
It is not until a 1000-1100+ peak push that we can see that it is not able to handle all those responses and after 12 seconds several reequests fail.
Conclussion
It can be concluded after all this information that to mantain an optimal UX experience we should manage to:
- Do not exceed a consistant rate of 280 requests/sec, that would translate into 24.2M requests in a day, if mantained.
- Do not exceed a request peak of 1000 requests in a single push.
Otherwise, a proper elastic environment should be properly deployed.